Data Modeling 201 for the cloud: designing databases for data warehouses

*** This blog is based upon webcast which can be watched here. ***
Designing databases for data warehouses or data marts is intrinsically much different than designing for traditional OLTP systems. In fact, many commonly accepted best practices for designing OLTP databases could well be considered worst practices for these purely analytical systems. Accordingly, data modelers must embrace some new tricks when designing data warehouses and data marts. And although some of the advice contained within may seem contrary to what you are comfortable with, please keep an open mind. Remember that Seinfeld’s George Costanza did not land his dream job with the NY Yankees until he embraced doing the opposite of every idea he had, as seen in the video clip below. So, let go of any old OLTP design.
Data modeling for the cloud: good database design means “right size” and savings
As with the part 1 of this blog series, the cloud is not nirvana. Yes, it offers essentially infinitely scalable resources. But you must pay for using them. When you make poor database design choices for applications deployed to the cloud, then your company gets to pay every month for all inevitably resulting inefficiencies. Static over-provisioning or dynamic scaling will run up monthly cloud costs very quickly on a bad design. So, you really should get familiar with your cloud providers sizing vs. cost calculator.
Look at Figure 1 below. It shows pricing for a data warehousing project with just 4 TBs of data, small by today’s standards. I chose “ON Demand” for up to 64 virtual CPUs and 448 GB of memory since I wanted this data warehouse to fit entirely, or at least mostly, within memory for lightning-fast access. So, that’s $136,000 per year to run just this one data warehouse in the cloud. If I can cut down on the CPU and memory needs, I can cut this cost significantly. So, I do not want to over-provision to be safe. I want to right size this from day one based upon a good database design that does not waste resources due to inefficient design.
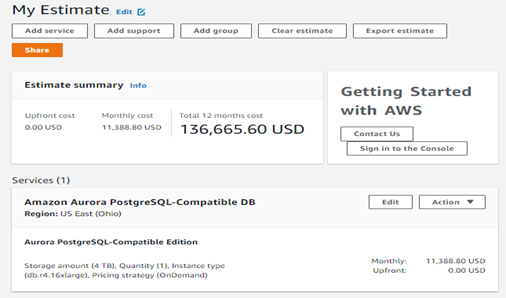
Figure 1: Pricing for a 4 TB data warehouse in AWS.
Now to cover some data modeling basics that applies no matter whether on-premises or in the cloud.
The first and most important thing to recognize and understand is the new and radically different target environment that you are now designing a data model for.
| OLTP | ODS | OLAP | DM/DW | Data Lake | |
| Business Focus | Operational | Operational Tactical | Tactical | Tactical Strategic | Analytical
Machine Learning |
| End User Tools | Client Server Web | Client Server
Web |
Client Server | Client Server
Web |
Cloud
Web |
| DB Technology | Relational | Relational | Cubic | Relational | Natural/Raw Format |
| Trans Count | Large | Medium | Small | Small | Varies |
| Trans Size | Small | Medium | Medium | Large | Varies |
| Trans Time | Short | Medium | Long | Long | Varies |
| Size in Gigs | 10 – 200 | 50 – 400 | 50 – 400 | 400 – 4,000 | 1,000 – 10,000 |
| Normalization | 3NF | 3NF | N/A | 0NF | N/A |
| Data Modeling | Traditional ER | Traditional ER | N/A | Dimensional | ??? |
Figure 2: Database design characteristics
The major underlying design principle is that users will be running a relatively small number of requests, as compared to an OLTP system, which scans hundreds of thousands to millions of rows from extremely large tables and apply aggregate functions to summarize that data into a small number of output rows. For this target environment you will not want to normalize data as you would in an OLTP system. In fact, to quote the movie Young Frankenstein, letting your brain work “abby normal” will serve you very well.
Star schema: a data modeling and database design paradigm for data warehouses and data lakes
Ralph Kimball developed a data modeling and database design paradigm for this very need, it’s called dimensional modeling and/or star schema design. I first met Ralph in the early 1990’s while attending one of his seminars. I was working for Logic Works, the original home of erwin, and showed Ralph how data modeling tools could leverage his ideals. I published my first book in 2003 showcasing how I used Ralph’s technique to create a large data warehouse in the Oracle database.
Star schema design is actually quite simple. There are just two kinds of entities and/or tables:
- Dimensions: smaller, de-normalized tables containing business descriptive columns that end-users query on
- Facts: very large tables with primary keys formed from the concatenation of related dimension table foreign key columns, and possessing numerically additive, non-key columns used for calculations during end-user queries
Let’s take a simple, existing OLTP data model and see how one transforms it into a star schema design.
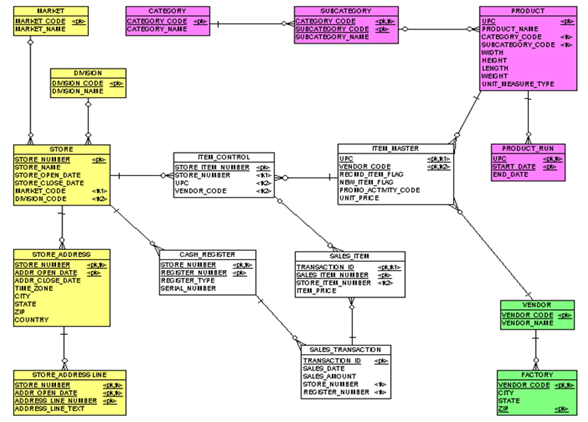
Figure 3: A data model of an OLTP point-of-sale system.
This is a data model of an OLTP convenient store point-of-sale and ordering system. I’ve watered it down a bit to make it simple enough for use as an example. Note the various colors, they basically represent subject areas of like entities within this data model. So, in step #1, we simply identify all our dimensions and facts. The yellow entities flattened down to the store dimension, and the magenta entities flattened down to the product dimension. The green entities were not incorporated into the data model at all, and the white entities became the fact.
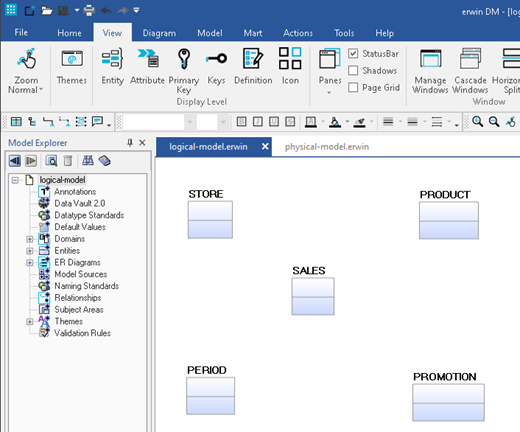
Figure 4: A logical data model of the point-of-sale system before relationships are added.
So where did the period and promotion entities come from? Well, in most any data warehouse you’re going to need a time dimension as business users like to see data for given dates. So, you always will have some kind time dimension. The promotion entity is new as the business users tell us that one of the key items they want to be able to see via the data warehouse is how effective are their promotions.
As for step #2, that’s very easy – just add the relationship between the facts and all its dimensions. Note that all the relationships are identifying. See how the fact is at the center of a star? Hence the name star schema.
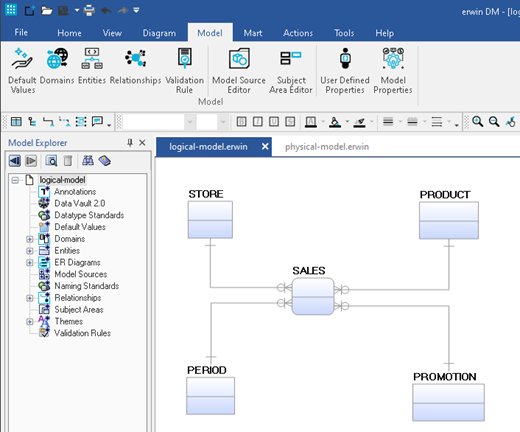
Figure 5: A logical data model of the point-of-sale system after relationships have been added.
Now if you’re lucky, your data modeling tool will offer diagrammatic support for the star schema design. Here we see that erwin offers such a feature. However, many other data modeling tools do not offer this capability.
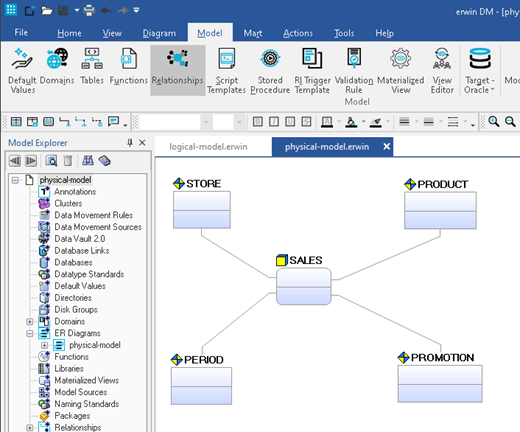
Figure 6: A star-schema display format of the point-of-sale system’s physical data model.
Now all that’s left is to place all the attributes from the OLTP data model into one of our dimensions or facts. You will end up with a model that looks something like this.

Figure 7: The star-schema physical data model after placing all attributes from OLTP system and creating some new aggregate facts.
You can pre-scan and pre-aggregate data to speed up queries
Did you notice that the sales concept got broken down into three separate facts? In talking to the business users, we found out that they often desire weekly or monthly reports or analysis. So, we therefore have built some facts which are basically aggregates of the base fact, so, that we have essentially pre-scanned and pre-aggregated some of the data to speed up those queries.

The creation of such aggregate facts is very normal. They do not have to be simple time-based ones like was shown in the prior example. It could be by region or time zone or even by product of interest. For example, the convenient store company in this example had a Texas aggregate and a beer aggregate as shown here because they are headquartered in Texas and beer accounts for over 30% of all profits. In fact, the “beer person” is the #3 executive in the company, so they deserve their own aggregate.
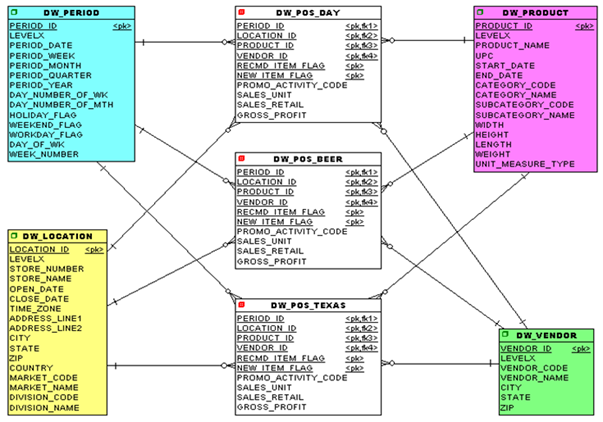
Figure 8: The star-schema physical data model after creating some new, business specific and justified facts.
Don’t obstruct the optimizer from seeing it’s a star schema
Finally, the one thing you want to avoid in a star schema design is snowflaking (this has nothing to do with the Snowflake database). Many database optimizers recognize the star schema and have code to optimize their execution by orders of magnitude. But you must not add anything to the picture which complicates or even obstructs the optimizer from seeing it’s a star schema. Here is an example of a snowflake added to our prior star schema model.
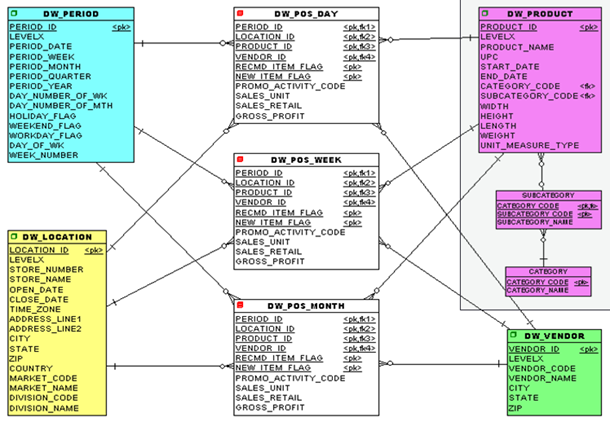
Figure 9: An example of a Snowflake that complicates the optimizer from seeing it’s a star schema.
While adding the category and subcategory might make sense as a normalization effort, the extra layers of relationships will often confuse the database optimizer resulting in orders of magnitude slow query execution times. So please avoid snowflakes.
As we’ve seen in this blog, data modeling for a data warehouse is very different from doing one for an OLTP system. But there are techniques which can result in highly successful data warehouses, and there are data modeling tools like erwin designed to support modeling using such capabilities.
Related links:
Like this blog? Watch the webinars: erwin Data Modeling 101-401 for the cloud
Blog: Data Modeling 101: OLTP data modeling, design, and normalization for the cloud
Case Study (Snowflake cloud): Credit Union Banks on erwin Data Modeler by Quest
Whitepaper: Meeting the Data-Related Challenges of Cloud Migration
Even more information about erwin Data Modeler
Video: Empower 2021: Fireside chat – Model-driven DevOps – What Is It?
Video: Empower 2021: Mitigating the risk associated with sensitive data across the enterprise
Webcast: Build better data models
Whitepaper: Top 10 Considerations for Choosing a Data Modeling Solution
Are you ready to try out the newest erwin Data Modeler?DevOps GitHub integration via MartOne-click push of data modeling data definition language (DDL) and requests to GitHub/Git repository via Mart. Get a free trial of erwin Data Modeler Got questions? Ask an Expert |
Join an erwin user group.
Meet with fellow erwin users and learn how to use our solutions efficiently and strategically. To start, we’ll meet virtually twice a year, with plans to expand to meet in person. Hear about product roadmaps, new features/enhancements, interact with product experts, learn about customer successes and build and strengthen relationships. Join a group today.
Like this blog? Subscribe.
If you like this blog, subscribe. All you need to provide is your name and email located at the right margin of this blog post.
Help your colleagues
If you think your colleagues would benefit from this blog, share it now on social media with the buttons located at the right margin of this blog post. Thanks!
