What is advanced analytics?
The term “advanced analytics” gained widespread recognition in the fields of data analysis and business intelligence (BI) during the early 2000s. Technological advancements during this period — particularly in areas such as machine learning, predictive modeling and big data analytics — resulted in the creation of more robust analytical methods.
Today, advanced analytics encompasses a broad array of techniques and methodologies used to extract deep insights from data. This enables business users to make better-informed decisions based on more sophisticated analysis that goes beyond purely historical data reporting.
Shifting from traditional BI to advanced analytics for enhanced decision-making
Advanced analytics techniques surpass traditional BI capabilities to extract deeper insights from data. While the primary focus of BI is reporting on historical and current events, advanced analytics primarily focuses on providing deeper insights, predictions and supporting long-term decision making.
However, BI tools have evolved over the years, and today many BI tools offer various advanced analytics capabilities. For example, a number of BI tools now can integrate Python and R scripts, both of which are programming languages commonly used to create predictive models and machine learning algorithms. Most BI tools, such as Tableau and Power BI, also provide the flexibility to create custom calculations for complex statistical analysis, group similar data points and enable predictive forecasting.
To see how advanced analytics augment traditional BI capabilities, let’s consider an example: analyzing customer churn. When using traditional BI capabilities alone, we can generate a report that presents historical customer churn over a specific period of time. This report would enable us to compare the number of total customers with the number lost. Unfortunately, a traditional BI report cannot forecast whether customer churn will rise or fall. Advanced analytics can achieve this once you collect and prepare data that could impact customer churn — customer demographics, satisfaction levels, and political and economic conditions. With this information, you could create a predictive model using advanced analytics techniques like machine learning or utilize the forecasting capabilities in BI tools to help you understand your customers’ behavior and predict the level of churn. By gaining visibility into factors that impact customer churn, organizations can proactively make decisions that drive positive business outcomes.
Why data intelligence facilitates advanced analytics in BI tools
Data intelligence greatly supports advanced analytics, especially within BI tools. Having a comprehensive understanding of data used for BI initiatives — including its quality and lifecycle — is an important prerequisite for implementing advanced analytics in your organization.
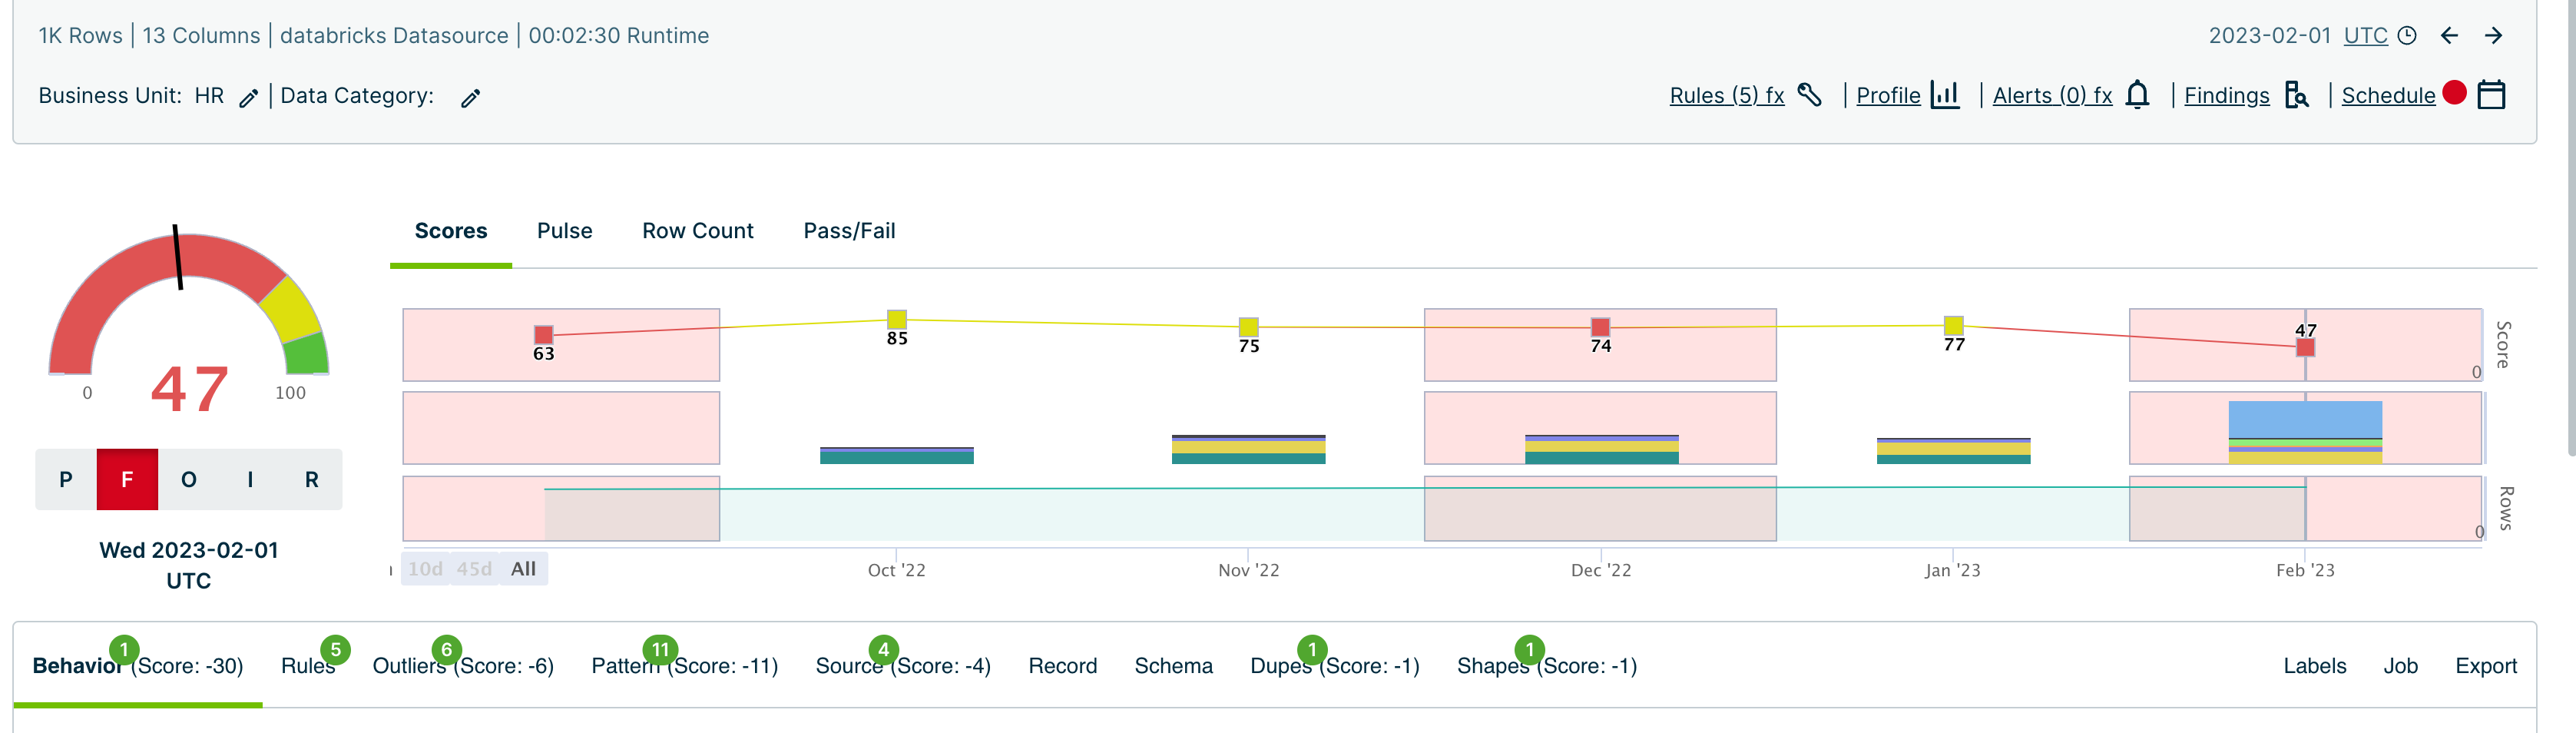
Data quality scores are displayed in Collibra.
A robust data intelligence platform can enhance advanced analytics in BI tools by:
- Establishing a unified view of data across BI tools and other sources with useful business context, helping users efficiently find suitable data for advanced analytics
- Building a foundation of data governance to help create a shared understanding of data being used for advanced analytics
- Helping to ensure compliant access of trustworthy data assets, including data models, reports and dashboards
How Collibra can help
Collibra Data Catalog helps users easily inventory and visualize relevant information about data residing in various sources, including BI tools, making it more accessible to a wider audience. This enables individuals to efficiently find, assess and select the right data needed for their advanced analytics initiatives. Once you have a thorough understanding of your data, you can begin applying advanced analytics techniques such as predictive modeling, AI/machine learning and data mining.
With integrated data governance in Collibra, users can gain faster access to reports and dashboards so they can easily locate the information they need without having to sift through numerous reports for hours on end. In addition, the platform facilitates the assessment of the data’s quality and its appropriateness for use.
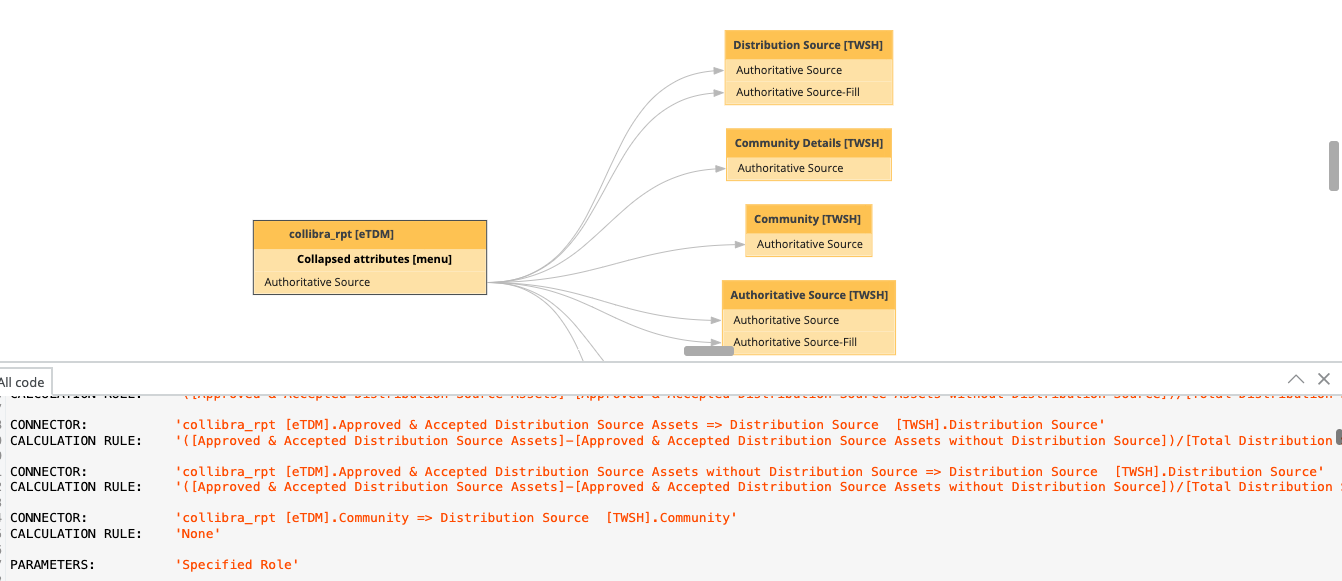
Tableau lineage shows calculation rules and parameters in the source code.
Our platform also enables the effortless tracking of data and report lineage, including calculations and parameters. Through this increased visibility, data scientists can confidently certify reports so business users know they can trust the data.
Additionally, Collibra’s Data Marketplace assists in easily finding and selecting reports or dashboards across different BI tools, reducing the need to switch from one platform to another. A URL on the asset page provides direct access to the report or underlying dataset, while users can also view information such as who owns the report and dataset.
Learn more at Data Citizens ‘24
To learn more, join us at Data Citizens on April 9-11, 2024 for an interactive session titled “Data intelligence for advanced analytics”, where you’ll gain insights into leveraging Collibra for metadata management, lineage tracking and data discovery with Power BI and other analytics platforms enabling you to make informed decisions based on trusted data.