Last month Collibra launched Usage Analytics. This new realtime adoption analytics dashboard capability allows admins to understand the usage of Collibra and the organization’s knowledge graph among its users. Its purpose is to provide actionable insights into how users are utilizing the platform, and which information they engage with, helping admins to better understand how their data curation and adoption efforts are going. This is a milestone product evolution in our journey to help organizations achieve success with data intelligence.
Measuring adoption has long been recognized as crucial for ensuring a successful return on investment (ROI) from software implementation. By understanding how users interact with the software, admins can identify areas for improvement and make changes to increase adoption. This secures higher ROI by maximizing the value of the software for the organization.
The goal of Collibra is to help you make data more accessible within your organization by creating a place where it can be searched, understood, and verified via its blueprint. As such, measuring adoption has an even greater importance, as success of your data intelligence program is a function of two.
Product adoption x Content adoption = Data intelligence adoption.
This is exactly the scope of our first version of Collibra Usage Analytics.
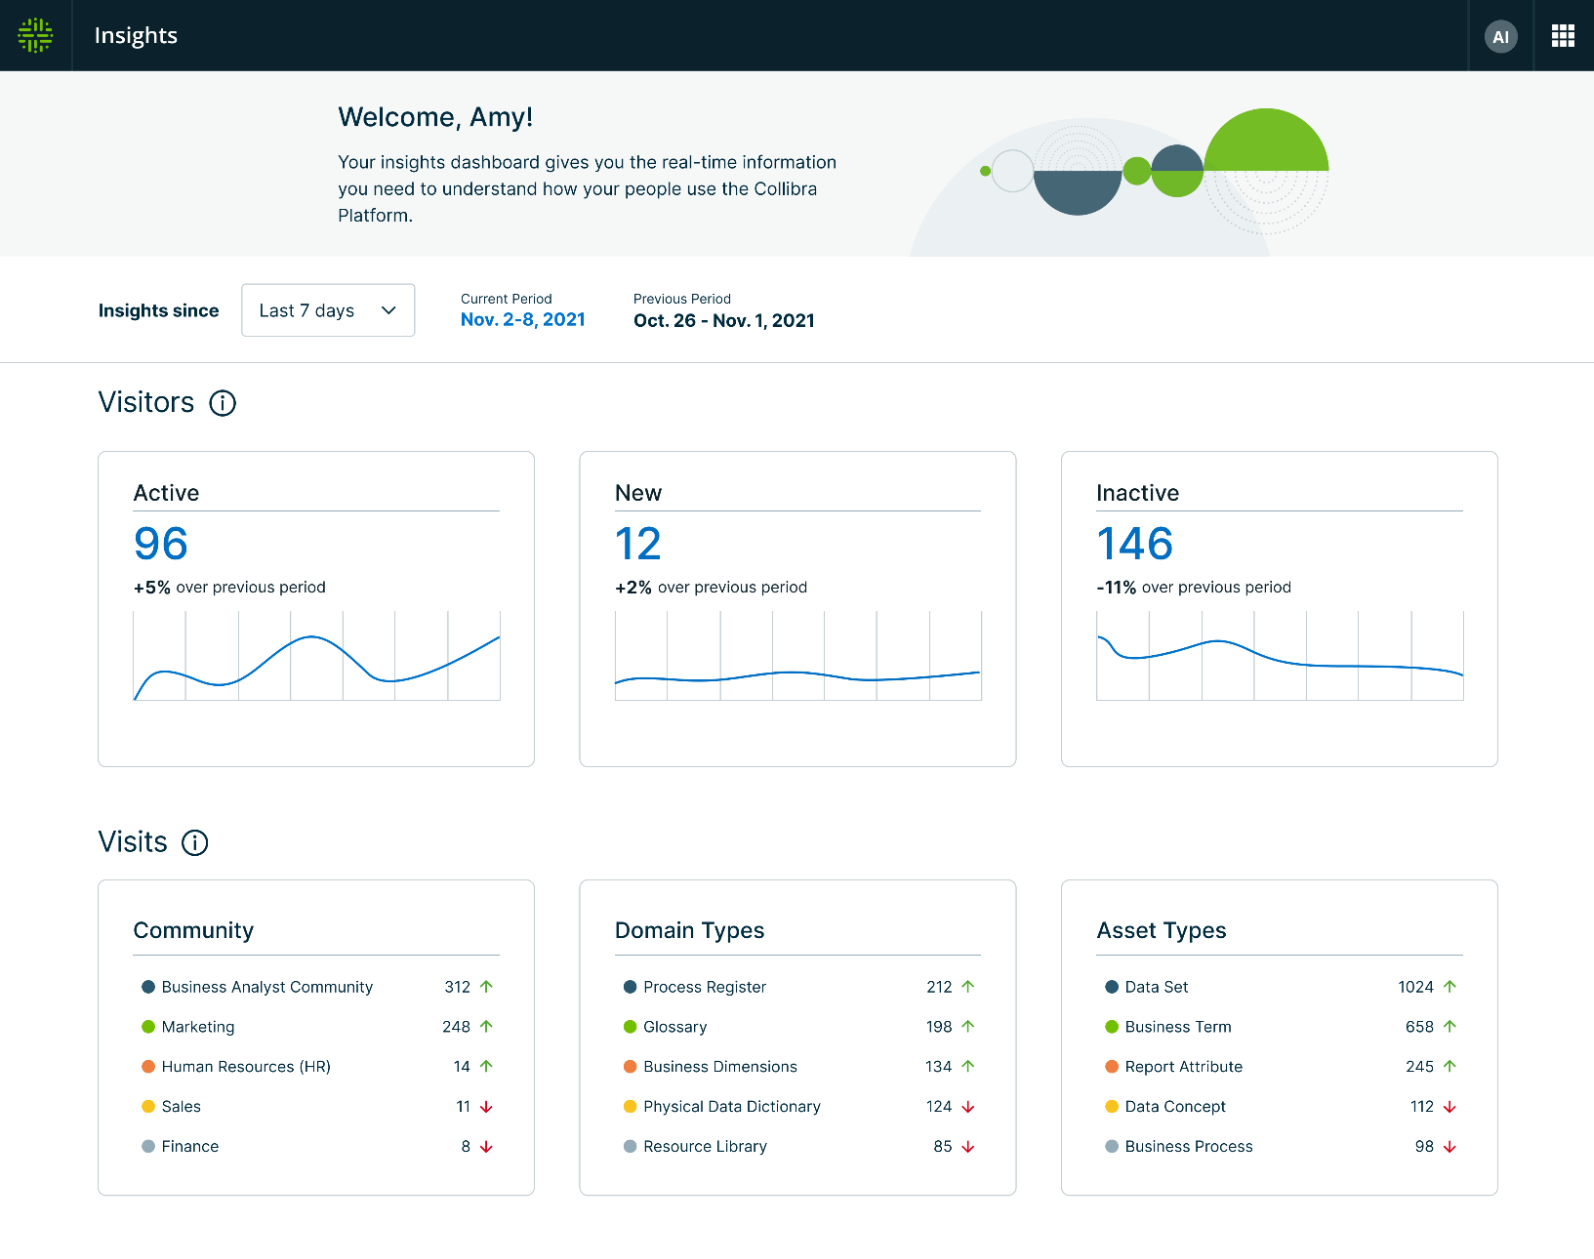
The first analytics theme is active users, providing the ability to track real time user adoption. Admins can see how usage of the software changes over the course of the data intelligence program, and identify trends that may indicate a need for additional training or support. This helps ensure that users are getting the most out of the software, and helps maximize your data intelligence investment.
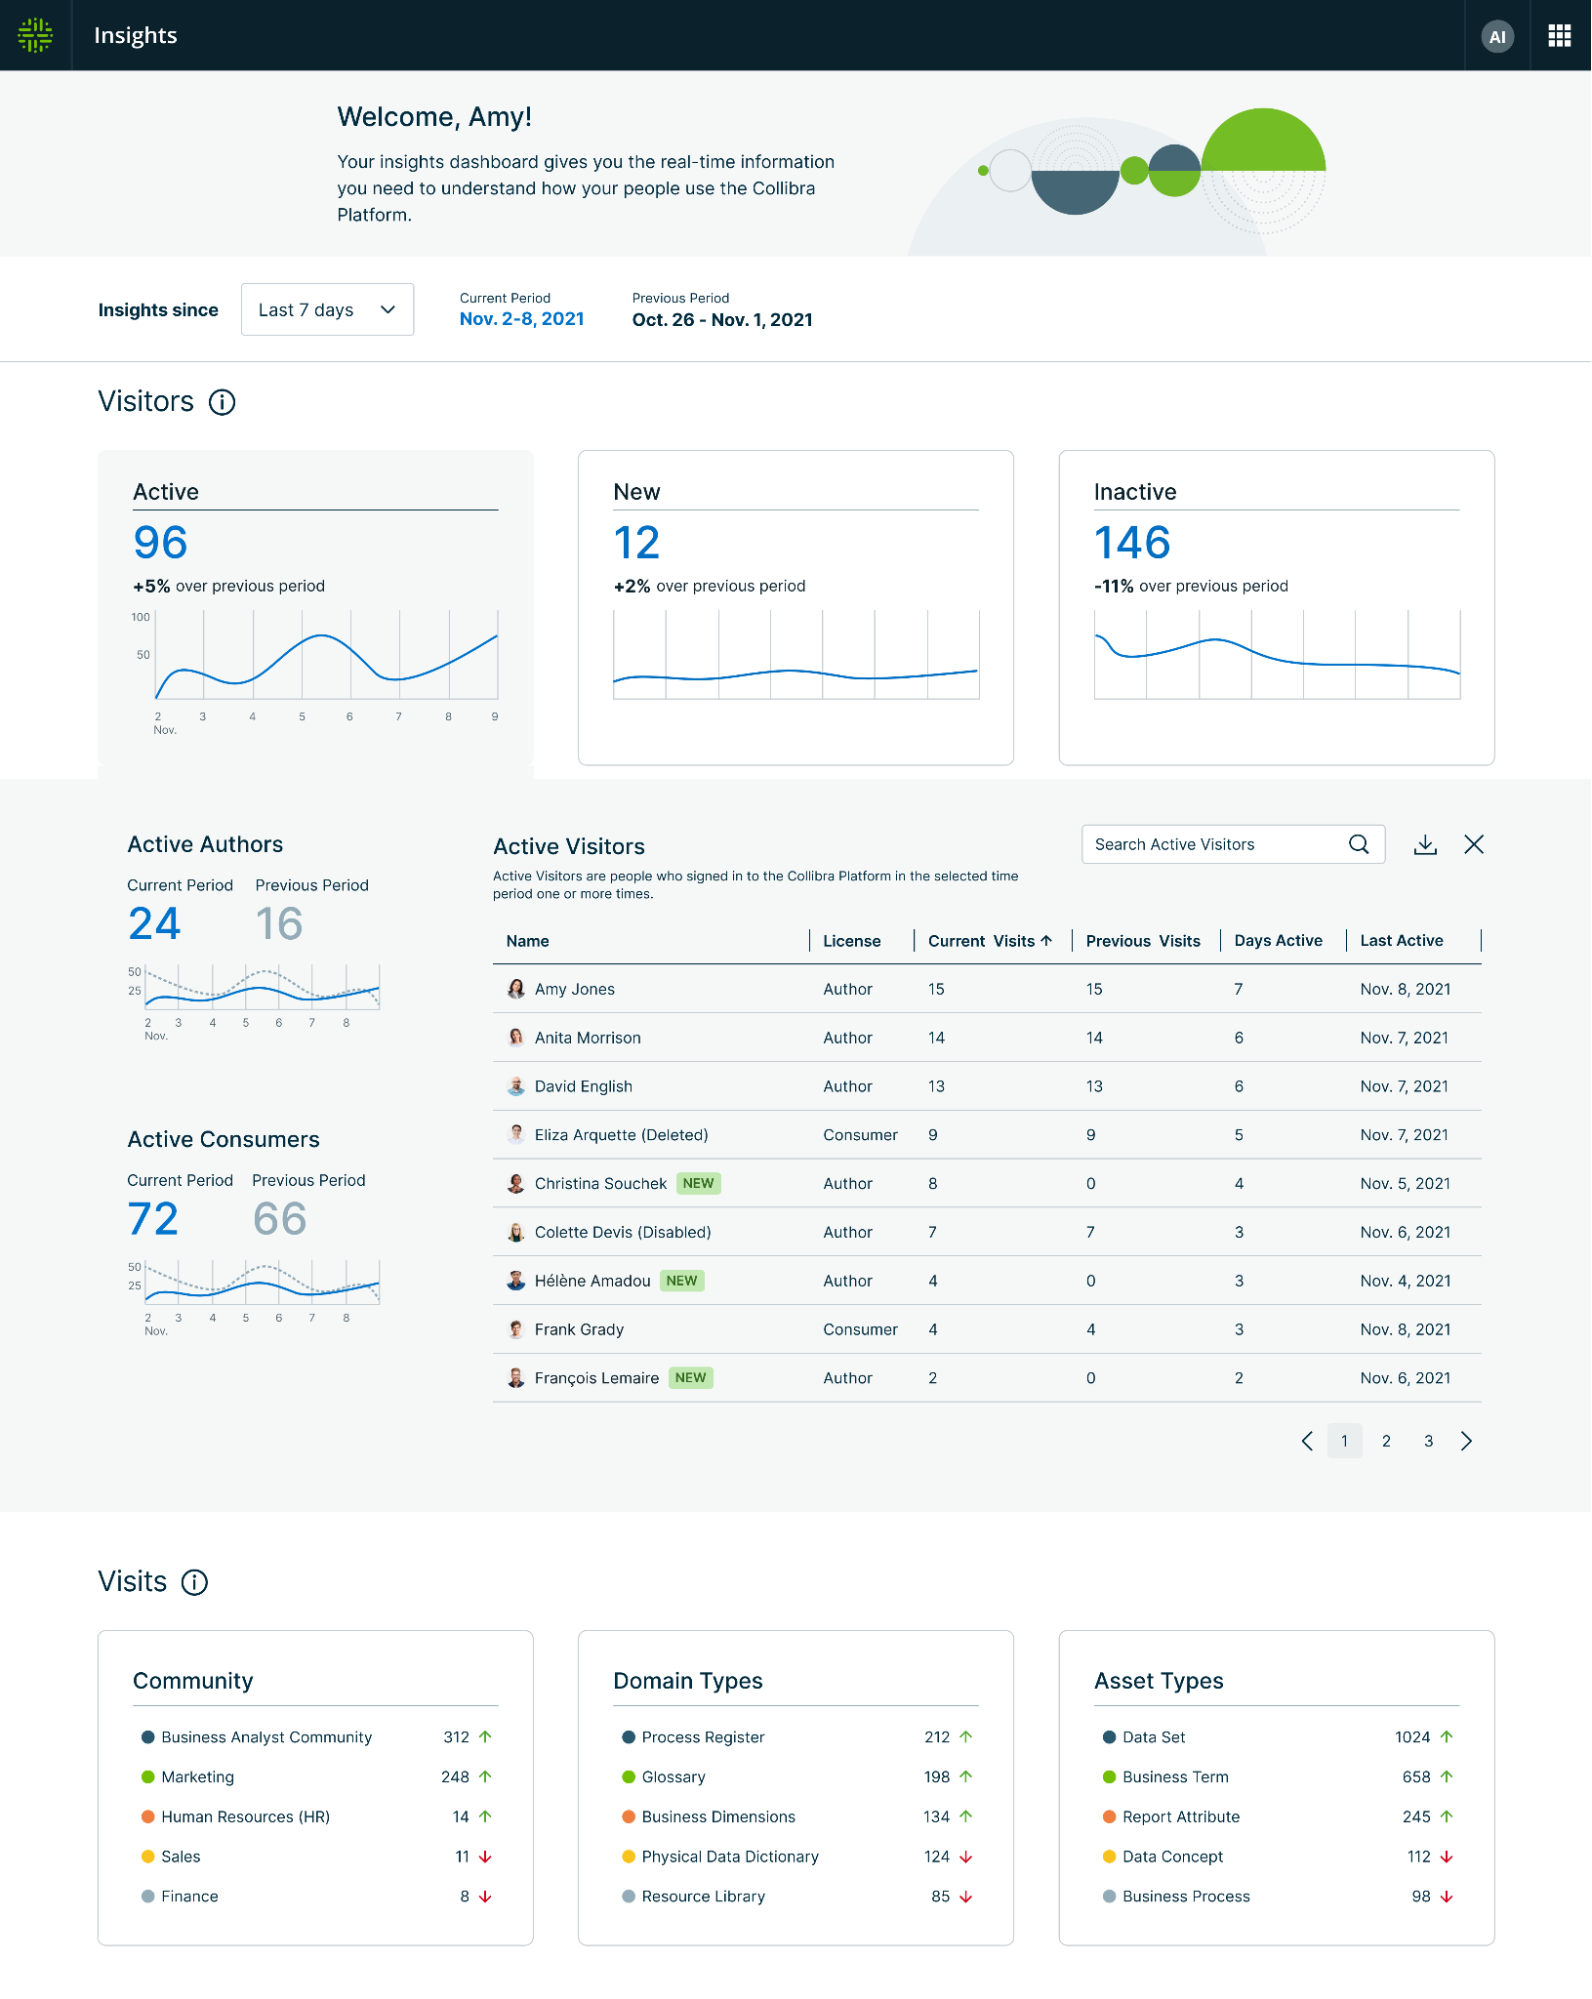
We highlight:
- Active users, with measures of activity per user, provides a comprehensive overview of user activity within the platform.
- New users focuses on user influx, and can be used as both an adoption measure (more demand means more interest) and insight into where enablement may be required
- Inactive users highlights users that have dropped out of being active recently, and may need a nudge to return to being product members of the data economy.
The second theme focuses on content adoption, with metrics helping you understand which information is accessed most often and by whom, along with how this changes over time. Without these insights, it is impossible to understand what makes users engage with their data intelligence platform, and what data is most relevant for them. Similarly, content viewership metrics allow data and business stewards to understand adoption of their information products, enabling them to better decide which content to articulate, which to promote, and which to sunset.
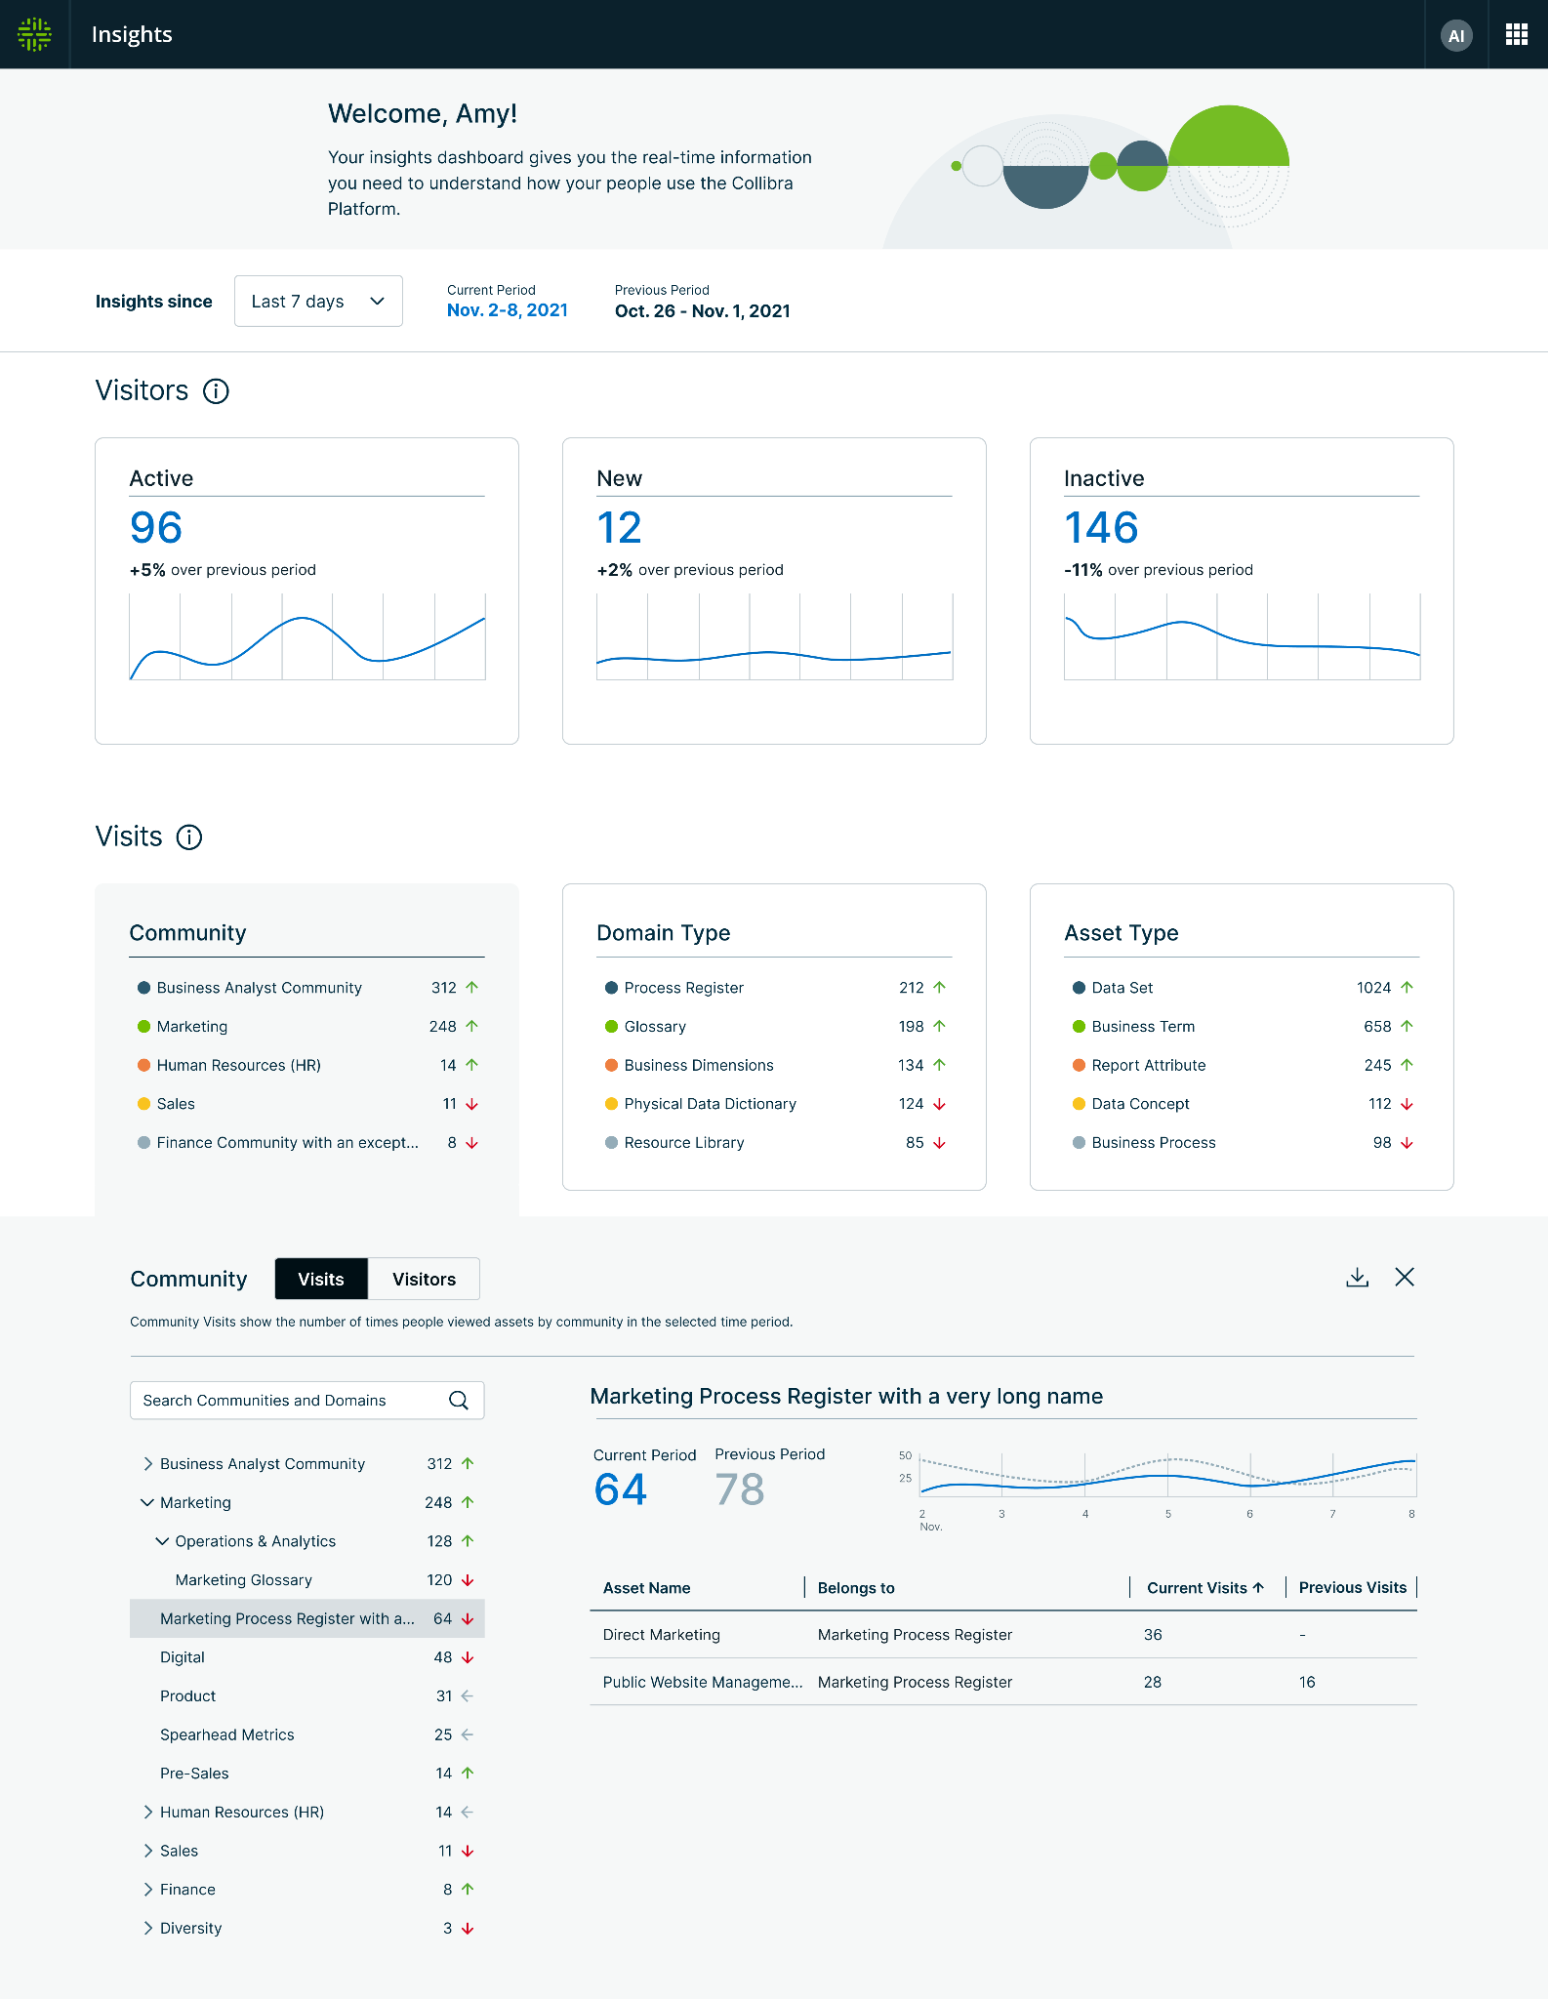
Under content consumption, we highlight three sections:
- Community
- Domain
- Asset type
Each offers real time viewership statistics with the ability to focus on an individual cross-section of information, and understand which content is most popular and which needs promotion or additional articulation.
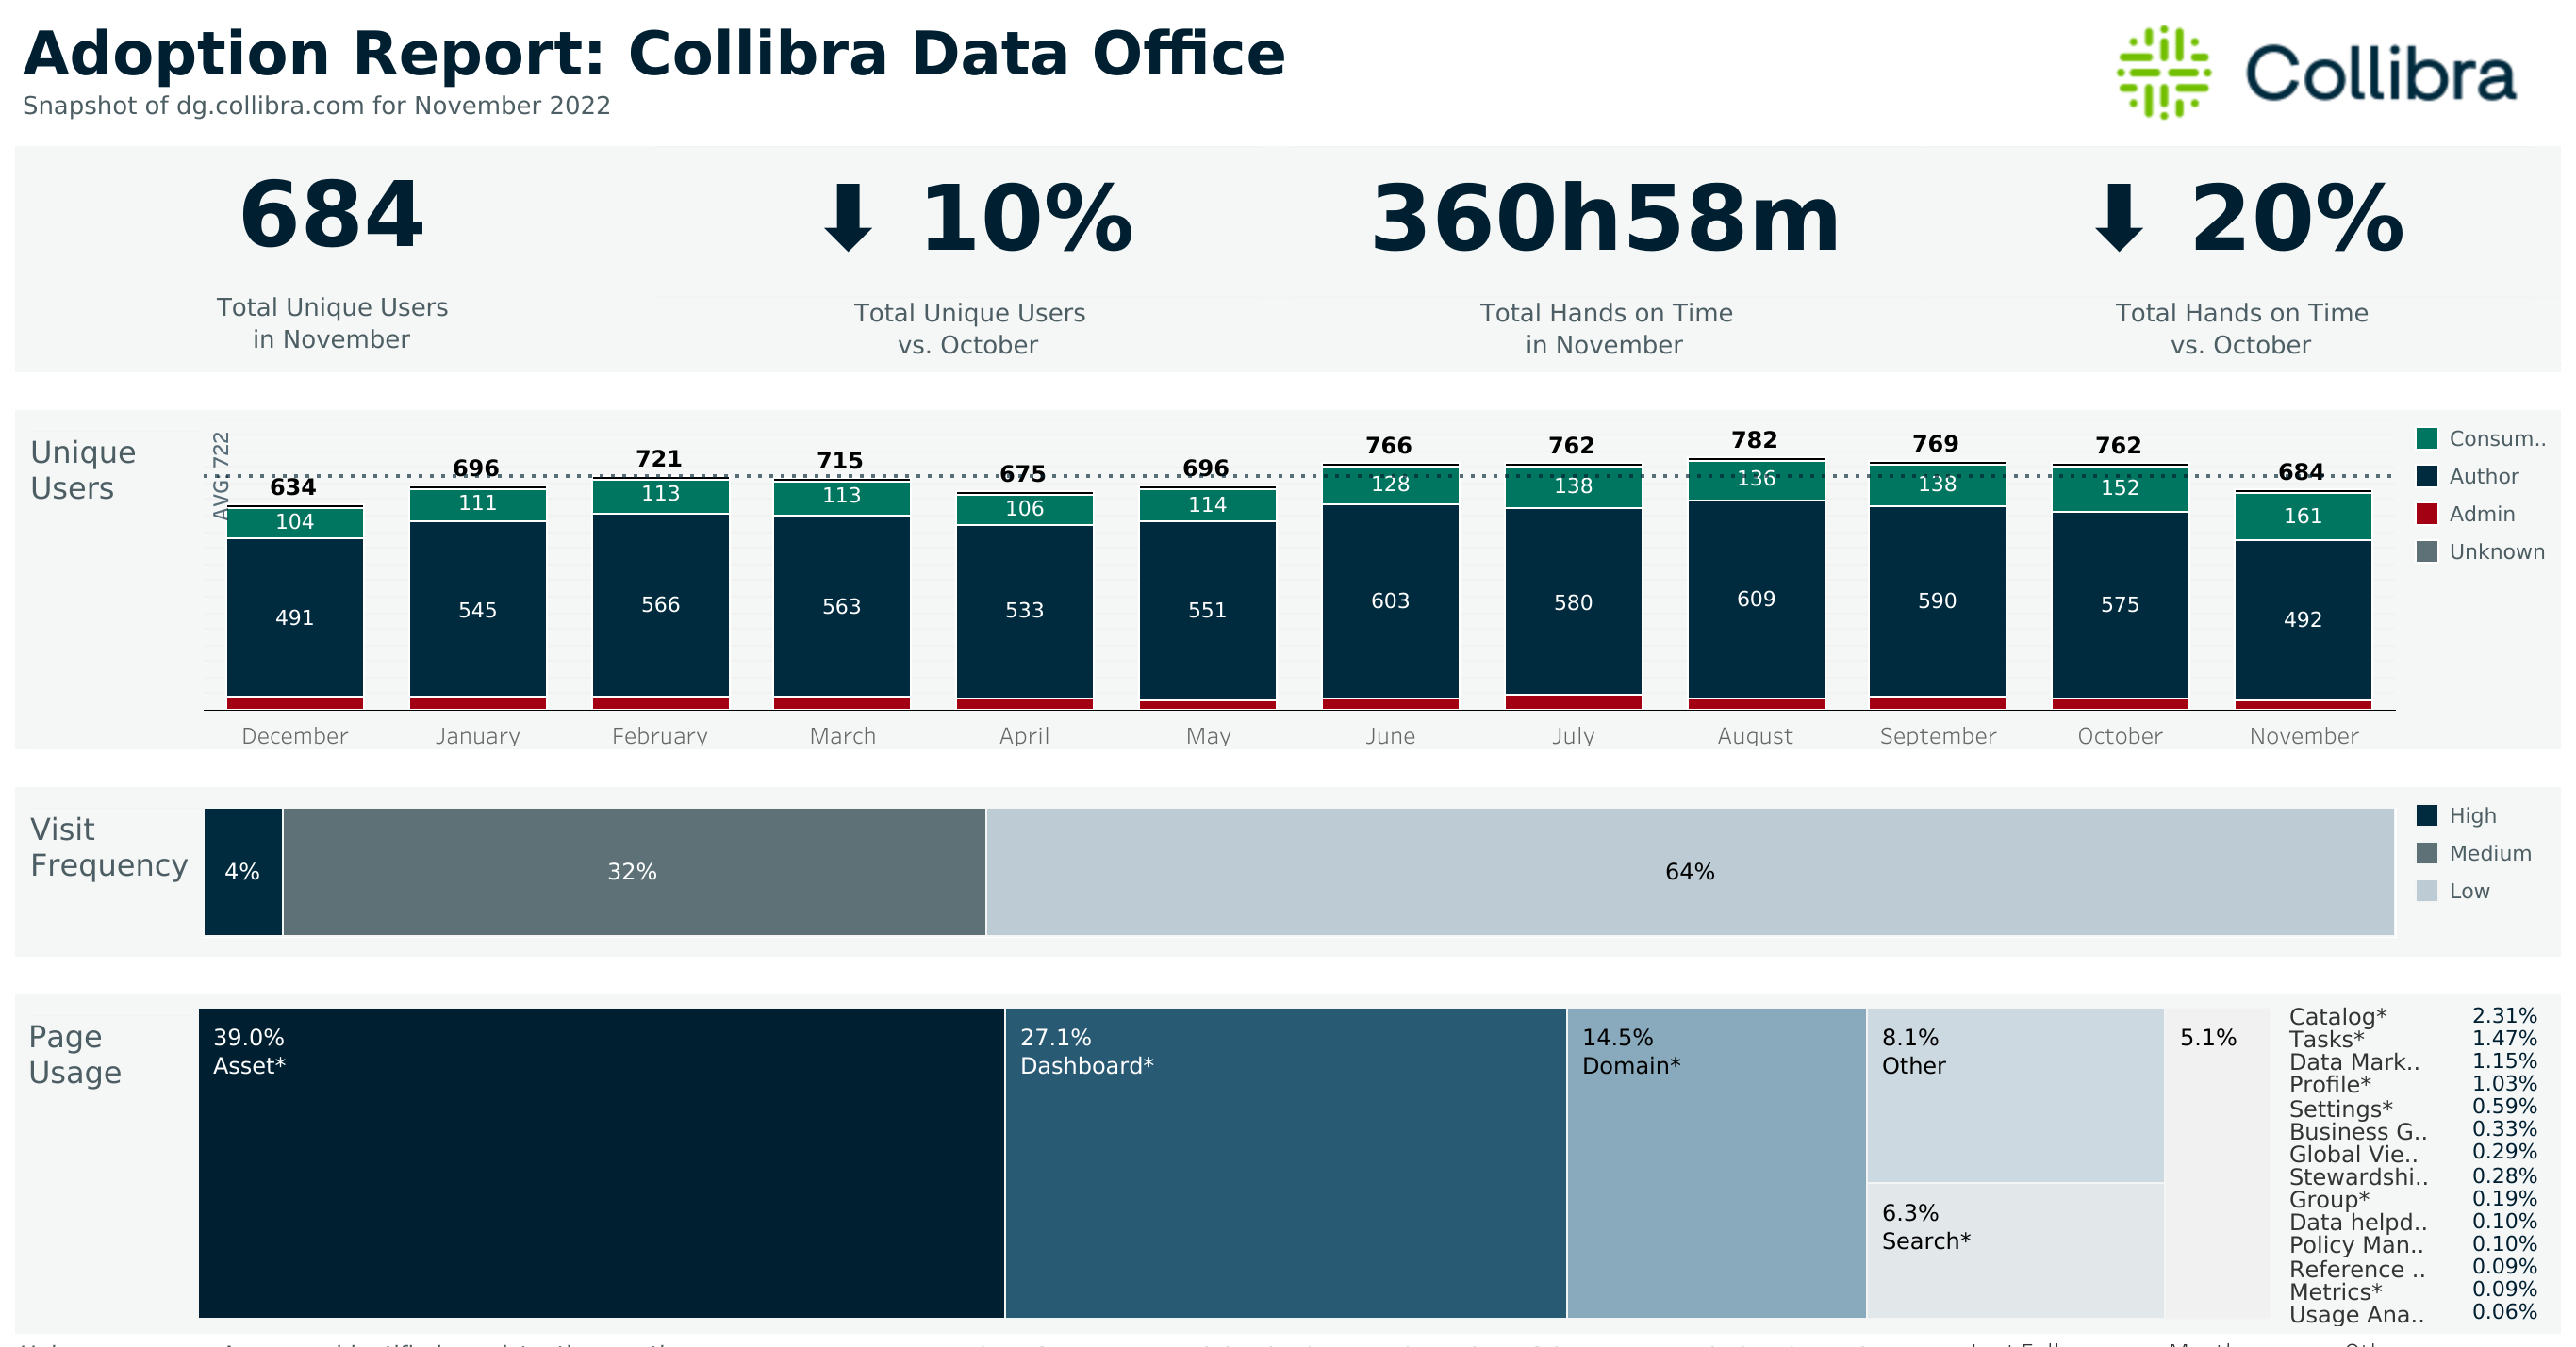
Existing customers of Collibra will know that our commitment to transparency on adoption goes back years. Since 2019, conversations with Customers have been structured around the Collibra Adoption report – an out-of-product analytics capability which allowed us to learn what our customers need in order to drive their programs successfully, and built the basis for the Usage Analytics roadmap.
Offering these analytics within the platform allows us to offer these insights on demand and in real time. The two themes available in our November release are just the beginning. We have so much more in the works, enabled by the engine which makes Usage Analytics a reality beneath the hood.
If you haven’t had a chance to check it out, we encourage you to start now. We’d love to hear what you think, and look forward to sharing more about this capability as we expand it. We’re just getting started.