


Business Process Management (BPM)
Flowcharting is one of the first tools used in analyzing an existing business process. The purpose of a flowchart is to document the tasks within a particular process, and their sequencing, visually.
How Is Flowcharting Used in Business Process Management?
Once the flowchart is created, it can be used for a number of different purposes. Here are some common use-cases for flowcharting in Business Process Management.
- Getting a shared understanding of the process as documented
- Analyzing the flow of the process to look for bottlenecks or other issues
- Identifying duplicate tasks or other resource allocation issues within the process
- Standardizing a process among different groups or departments
- Identifying and analyzing variations and exceptions

How to Read a Flowchart
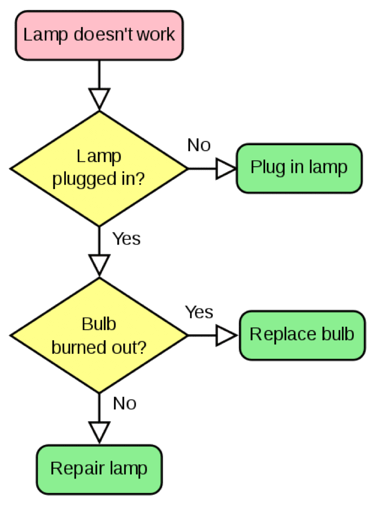
Here is a very basic flowchart from the Wikipedia article on flowcharting that depicts the steps for troubleshooting a faulty lamp. Let's use this example to explore the symbols and language of flowcharts.
While there are many tools that can be used to create flowcharts with a dizzying variety of symbols, at their most basic level, flowcharts really need just a few symbols to be effective.
 |
The Terminal Symbol – represented as circles, ovals, or rounded rectangles. They may contain the word "Start" or "End," or they may use a verb-noun phrase to depict the start or end of the process. |
 |
The Process Symbol is represented as a rectangle. It shows that some action or task is performed. |
 |
The Decision Symbol is represented as a diamond or rhombus showing where a decision is necessary, commonly a Yes/No question or True/False test. The decision symbol is peculiar in that it has two arrows coming out of it, usually from the bottom point and right point, one corresponding to Yes or True, and one corresponding to No or False. (The arrows should always be labeled.) More than two arrows can be used, but this is normally a clear indicator that a complex decision is being taken, in which case it may need to be broken down further or replaced with the "predefined process" symbol. |
 |
The Arrow (or Flowline) Symbol shows the order of tasks within the process. Arrows point from one symbol to another symbol. |
 |
Swim Lanes within the map denote the involvement of different people or functions within the process. |
Flowchart Best Practices
Here are twelve practices that will help improve the readability and value of your flowcharts.
- Every flowchart should start with a trigger. These are often written as a verb-noun phrase, e.g., "Submit expense report" within the starting terminal symbol.
- The flowchart should have a defined end, and because of the possibility of multiple decision points, it may have multiple ends. In our example earlier of the lamp, there are 3 endpoints (the green terminal symbols).
- All decision point paths should be resolved by connecting to either another step or a terminal symbol.
- Where possible, be consistent in how options are presented from decision points, i.e., "True" or "Yes" always comes from the bottom of the decision point, "False" or "No" always comes from the right side.
- It may make more sense to use branching instead of a decision point if there are more than two options.
- Arrows should not cross each other. If they do, the flowchart should be reorganized to avoid crossing the lines.
- For left-to-right languages like English, flowcharts should generally be developed from top left to bottom right.
- Flowcharts are generally more readable if they use standard symbols and use them consistently. Where different symbols are used, a key or legend should be provided.
- The flowchart should be kept as simple as possible. If it starts getting larger than a single page, it should be broken into multiple flowcharts. One way to do this is to identify the most common sequence within the primary flowchart and then develop additional flowcharts that show major variations. Another way is to break up major sequences into their own flowcharts – for example, an insurance claim process could be broken into separate processes and flowcharts for claim filing, claim investigation, and claim resolution.
- This also means hitting the right level of detail for the target audience. Senior management may need a higher-level flowchart with just a few steps, while staff members performing the work or trying to improve the process need a very granular, task-level flowchart.
- Similarly, language should be simple. A verb-noun phrase such as "Submit payment" is much easier to read and understand than a two-sentence description – and you'd need giant symbols or Lilliputian font sizes to fit all that text. If a longer description is needed, it can be included in a callout or in the actual process documentation.
- Consistency can significantly improve readability – this means keep the symbols the same size, use the same font and size, ensure spacing between symbols is consistent, etc.
When creating a flowchart, the tool itself really doesn't matter – in fact, the first step in creating a flowchart is often to either list steps, in a document or even on a piece of paper, or to use sticky notes to brainstorm the steps and the initial sequencing. Once you have the steps and sequence generally identified, it often makes sense to use a more formal flowcharting tool such as Microsoft Visio. These tools make it easy to be consistent in terms of symbol size and spacing, font and font size, have the arrows snap to symbols such that moving symbols automatically move the arrows, and so forth. Ultimately the value of the flowchart is in its readability and ease of use for its intended audiences.